[left]clc;clear;close all;
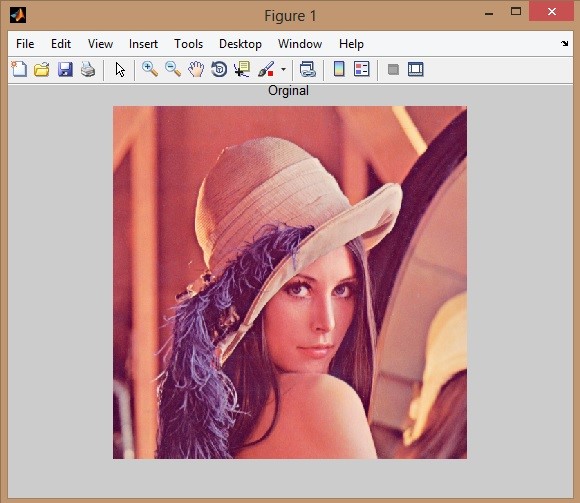
im=imread('D:\uni\image processing\lenna.png');
g=rgb2gray(im);
figure(1)
imshow(im),title('Orginal')
%***********************************************************
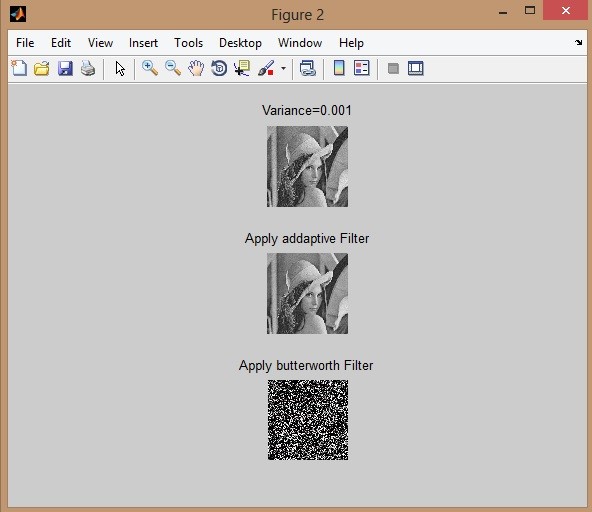
figure(2)
g = imnoise(g,'gaussian',0,0.001);
subplot(3,1,1),imshow(g),title(' Variance=0.001 ')
%***************adaptive filter
Smax=9;
f= adpmedian(g, Smax);
subplot(3,1,2),imshow(f),title(' Apply addaptive Filter ')
RMSE1=sqrt(mean (f(:)-g(:)).^2);
%***************butterworth filter
n =3; Wn = [2.5e6 29e6]/500e6;
ftype = 'stop';
[b,a] = butter(n,Wn,ftype);
filtered = imfilter(g, b);
subplot(3,1,3),imshow(filtered),title(' Apply butterworth Filter ')
RMSE2=sqrt(mean (filtered(:)-g(:)).^2);
%*************************************************************************************
figure(3)
g1 = imnoise(g,'gaussian',0,0.2);
subplot(3,1,1),imshow(g1),title(' Variance=0.2 ')
%****************adaptive filter
Smax=9;
g=g1;
f= adpmedian(g, Smax);
subplot(3,1,2),imshow(f),title(' Apply addaptive Filter ')
%****************butterworth filter
n =3; Wn = [2.5e6 29e6]/500e6;
ftype = 'stop';
[b,a] = butter(n,Wn,ftype);
filtered = imfilter(g, b);
subplot(3,1,3),imshow(filtered),title(' Apply butterworth Filter ')
%*************************************************************************************
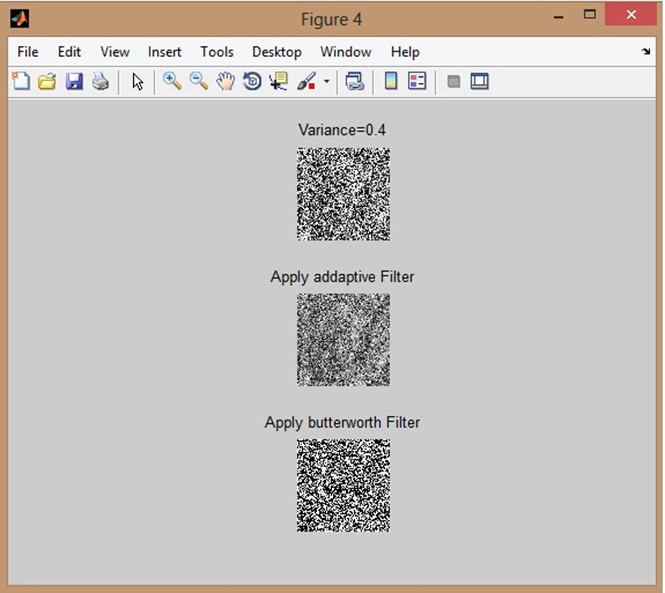
figure(4)
g2 = imnoise(g,'gaussian',0,0.4);
subplot(3,1,1),imshow(g2),title(' Variance=0.4 ')
g=g2;
%******************adaptive filter
Smax=9;
% g=g1;
f= adpmedian(g, Smax);
subplot(3,1,2),imshow(f),title(' Apply addaptive Filter ')
%*****************butterworth filter
n =3; Wn = [2.5e6 29e6]/500e6;
ftype = 'stop';
[b,a] = butter(n,Wn,ftype);
filtered = imfilter(g, b);
subplot(3,1,3),imshow(filtered),title(' Apply butterworth Filter ')
[/left]